Code Coverage
Total Test provides two ways to collect code coverage:
Code Coverage with Xpediter
Default. If no Code coverage daemon data is specified at the connection in scope for the execution, code coverage will be collected by Xpediter. Initially, Code Coverage with Xpediter is only supported for batch.
To collect code coverage with Xpediter:
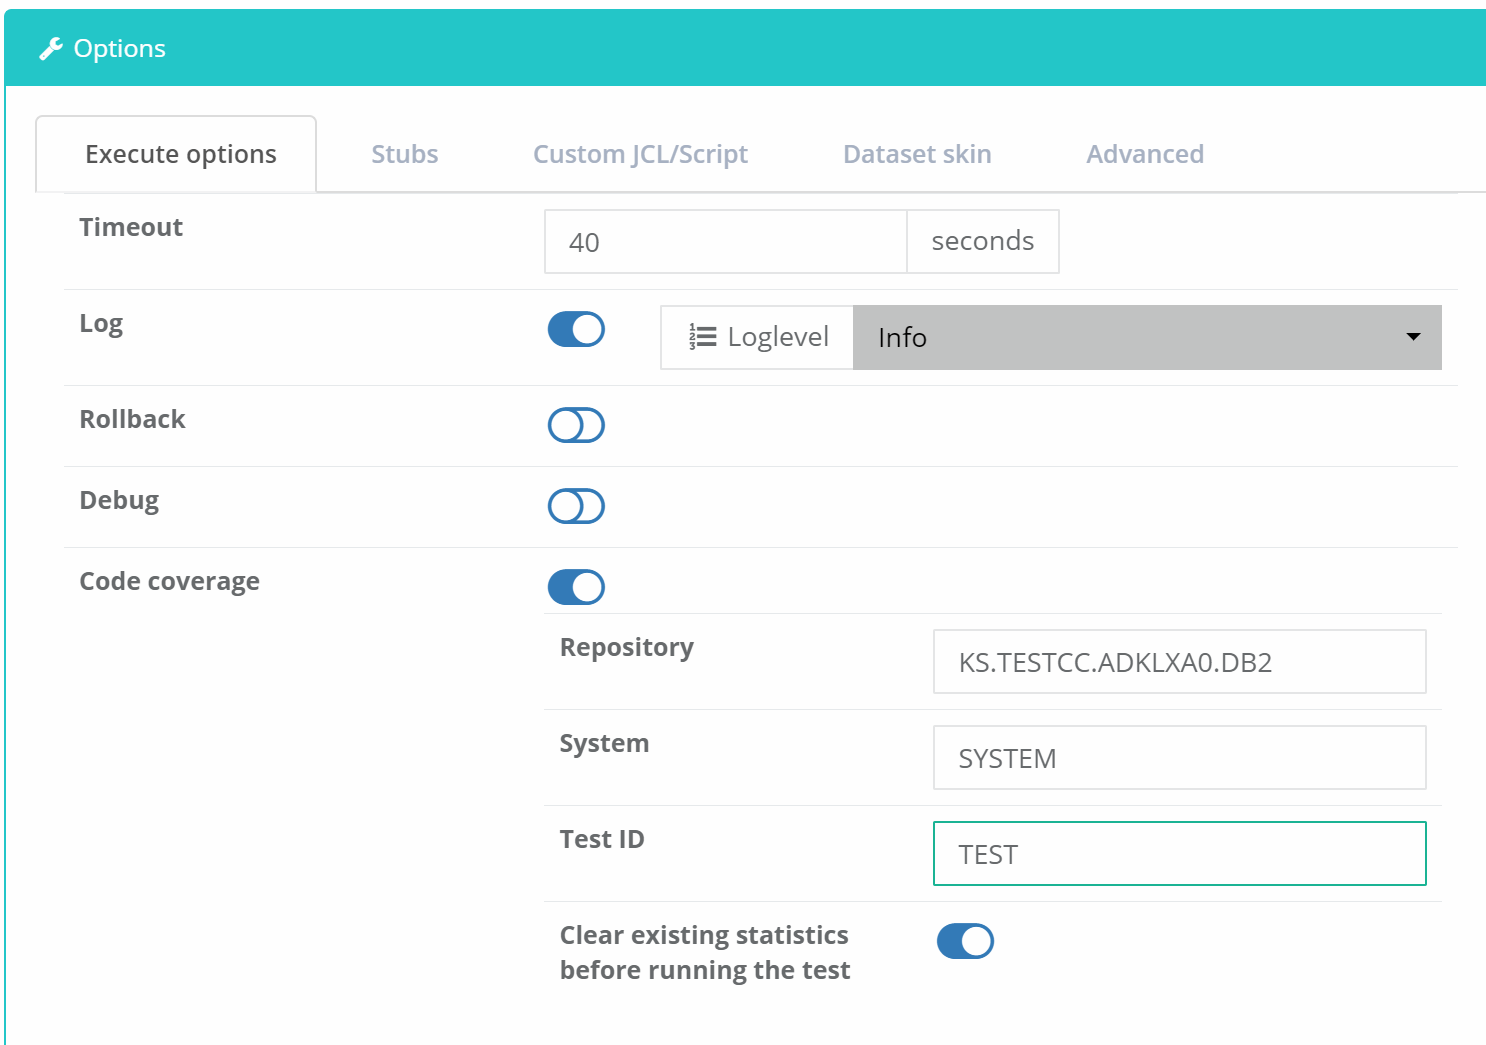
Enable the Code Coverage option in the Execute options tab.
Specify the Repository dataset where Xpediter will write coverage information. This dataset will later be fed into the Code Coverage reporting system to report on program invocations that occurred during the test session. Members with like systems, names, and compile date and times will automatically be merged together.
Specify or select a System name for this test. The System name drop down contains a list of recently used system names. Code Coverage keeps statistics by programs separated by system name. This name can be any user-specified name.
Specify or select a Test ID to be added to the Code Coverage test. This information can be useful when reviewing test reports from Xpediter/Code Coverage.
Enable the Clear existing statistics before running the test option to clear the statistics in the provided Repository, System and Test ID before the test is executed. Uncheck this option to keep any existing repository statistics.
Code Coverage and IDz Integration
Code Coverage will be activated in the Execution Context dialog if the connection definition in the Repository server includes values in the fields Collector ip address and Collector port in the section Code coverage daemon.
The IBM Debugger can generate code coverage information when a program is executed. Total Test is able to initiate this from a test scenario and it will also collect and analyze the result after the execution of the test scenario. When code coverage is enabled for a test scenario, the result of the execution will contain the resulting code coverage information. This includes the code coverage percentage for each module executed as well as color marking of the lines of code that have been executed.
Total Test can also initiate a debug session in IDz when you execute a program from the browser. The code coverage option is available in both clients while the debug option is only available in the browser. A debug session can only be initiated in IDz from version 14.0 and greater.
The Compuware Web Products Installation and Configuration Guide describes how to setup Total Test to initiate the IBM Debugger and it provides help in setting up IBM Debug and the IBM code coverage daemon.
When executing a program from the web browser it is possible to select if a debug session should be started or code coverage should be initiated. Click the Options button at the Execute page to see and change the options.
To collect code coverage with IBM Debugger:
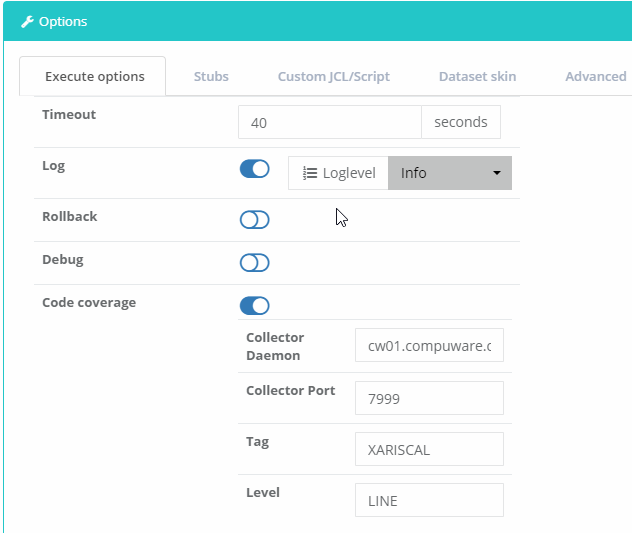
Enable the Code Coverage option in the Execute options tab.
Specify the code coverage Collector Daemon, Collector Port, Tag, and Level fields. The default value for the daemon IP address/port is taken from the Connection (that the Environment references).
The result of the code coverage can be seen directly in the execution result report.